New Core R Software Infrastrucutre for Flow Cytometry
- ncdfFlow: NetCDF, high-performace, disk-based access to large flow data sets.
- flowWorkspace: FlowJo workspace support. Import and reproduce FlowJo manual gating from wsp and xml files.
- OpenCyto: Template-based, data-driven, automated hierarchical gating.
FlowCAP III - 2012
- Automated gating of standardized Lyoplate-based flow cytometry data.
Highlights of R-based Flow Cytometry Tools and FlowCAP
Advanced Data Analysis Course, Cyto 2013, San Diego, CA
Greg Finak, PhD
Staff Scientist, Vaccine and Infectious Disease Division
Fred Hutchinson Cancer Research Center, Seattle, WA
Overview
R Tools for Flow Cytometry Data Analysis
R provides a suite of free, open-source tools for flow cyotometry data analysis.
- From storage, preprocessing, transformation, compensation, and gating, to downstream analysis.
Gating and Clustering
OpenCyto
flowClust
flowMerge
flowMeans
SamSpectral
FLAME
flowPhyto
flowFP
flowPeaks
flowKoh
NMF-curvHDR
SPADE
PRAMS
OpenCyto
flowClust
flowMerge
flowMeans
SamSpectral
FLAME
flowPhyto
flowFP
flowPeaks
flowKoh
NMF-curvHDR
SPADE
PRAMS
Discovery and Downstream Analysis
flowType
RchyOptimyx
MIMOSA
flowType
RchyOptimyx
MIMOSA
Infrastructure, Preprocessing and Visualization
flowWorkspace
ncdfFlow
flowCore
flowUtils
flowTrans
flowStats
plateCore
flowViz
flowQ
QUALIFIER
flowWorkspace
ncdfFlow
flowCore
flowUtils
flowTrans
flowStats
plateCore
flowViz
flowQ
QUALIFIER
ncdfFlow: large data sets, little memory
NetCDF-based storage of large flow cytometry data sets.
http://www.github.com/RGLab/ncdfFlow (Bioconductor)
- Data remains on disk (e.g. network drive) - accessed as if in memory - small RAM footprint.
- Handles large studies (1000's of FCS files).
- e.g. 34 FCS files from one lyoplate panel from nine sites.
f <- list.files(path="./Data/T-cell FCS files/",pattern="fcs",recursive=TRUE,full=TRUE)
dat<-read.ncdfFlowSet(f,ncdfFile="./myncfile")
| Data Object | Size |
|---|---|
| R object | 69.19 Kb |
| NetCDF Data file | 662.74 Mb |
flowWorkspace: Import your flowJo data
http://www.github.com/RGLab/flowWorkspace (Bioconductor)
Reproduce FlowJo gating in R from an exported workspace.
ws<-openWorkspace("./Data/Centralized T-cell.xml");
G<-parseWorkspace(ws);
plotGate(G[[1]],"24hi 38hi"); #Plot transitional gate
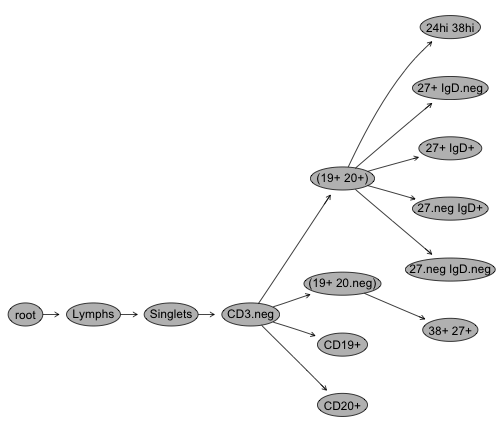
plot(G[[1]]); #Plot gating hierarchy
OpenCyto: A flexible framework for automated gating
http://www.github.com/RGLab/openCyto
Integrates flowWorkspace infrastructure with automated gating tools (Bayesian flowClust, flowCore, and others)
- Modular framework: plug-in your own gating algorithms
- High-level automated gating
- User defines hierarchy of cell populations and relevant markers
- Gating is data-driven. (User doesn't define gates just cell populations)
- Higher-dimensional gating (e.g. >2D) is available.
Framework abstracts away most of the R-coding.
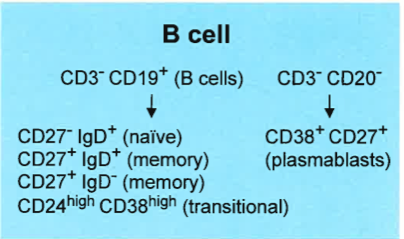
OpenCyto: Defining cell populations
Example CSV Gating Template Definition (Lyoplate B-cell Panel)
| Alias | population | parent | dims | method | options |
|---|---|---|---|---|---|
| nonDebris | nonDebris+ | root | FSC-A | flowClust | min=0 |
| singlets | singlets+ | nonDebris | FSCA,FSCH | singletGate | |
| lymph | lymph | singlets | FSCA,SSCA | flowClust | K=3,quantile=0.95,target=c(1e5,5e4) |
| cd3 | cd3- | lymph | cd3 | flowClust | K=3,neg=2 |
| cd19 | cd19+ | CD3 | cd20 | flowClust | K=2 |
| cd20 | cd20+ | CD3 | cd20 | flowClust | K=2 |
| cd19&!cd20 | cd19&!cd20 | cd3 | boolGate | cd19&!cd20 | |
| cd19&cd20 | cd19&cd20 | cd3 | boolGate | cd19&cd20 | |
| transitional | transitional | cd19&cd20 | cd38,cd24 | flowClust | K=5,gate_type='axis',target=c(3.5e3,3.5e3),quantile=0.995,axis_translation=0.35 |
R Code to Run the Gating
template<-gatingTemplate("bcellTemplate.csv")
fs<-readFlowSet(file="Data/Bcells/")
gs<-GatingSet(fs)
G<-gating(template,gs)
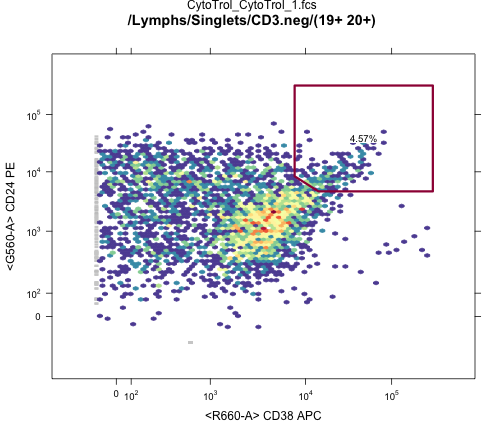
OpenCyto: View all gates
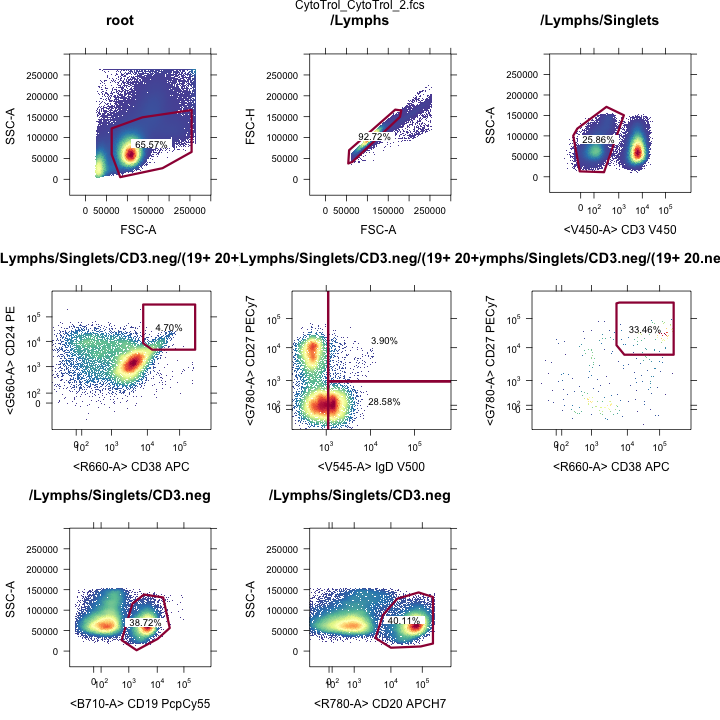
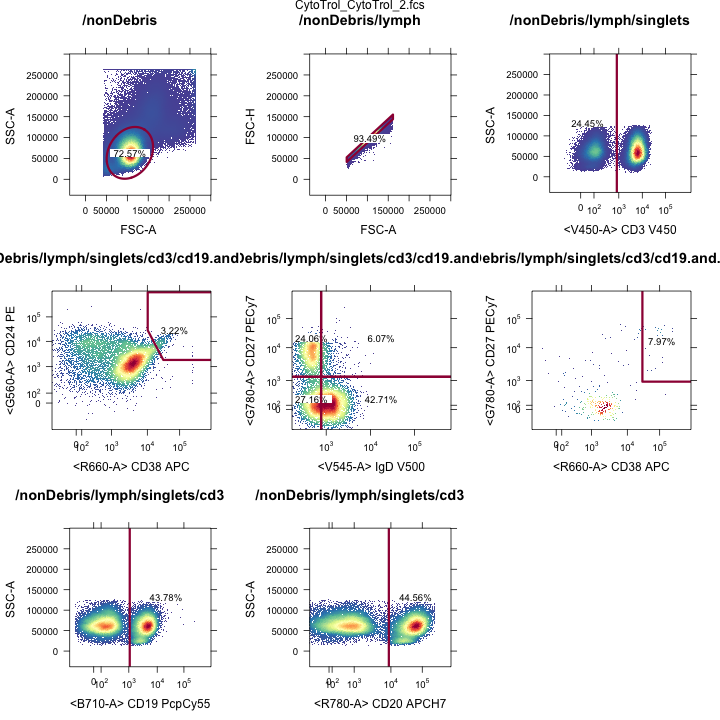
Manual Gating
Automated Gating
Gating Hierarchies
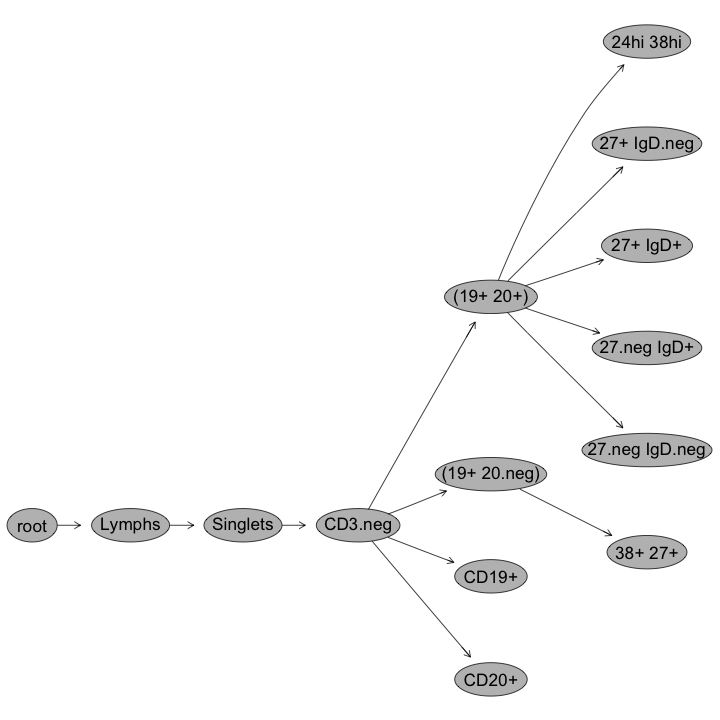
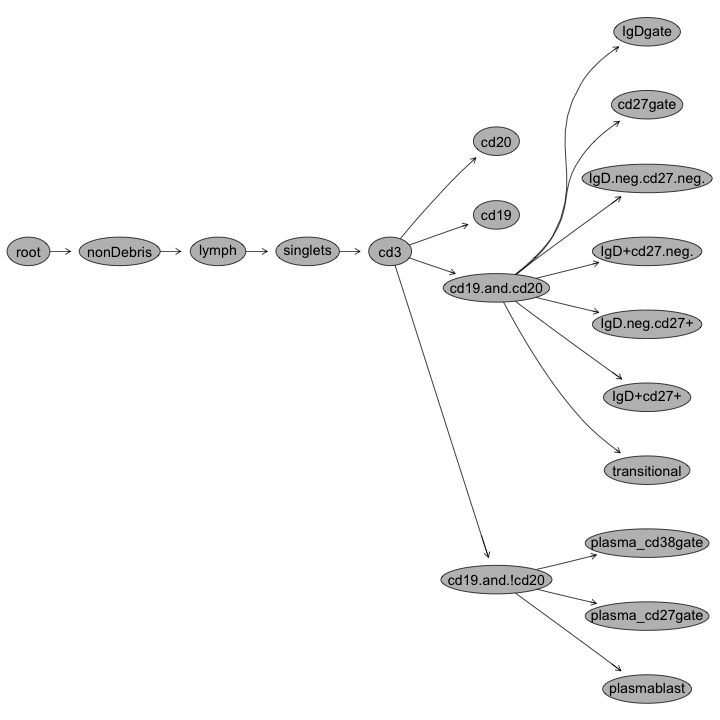
Manual Gating
Automated Gating
Transitional B-cell gates
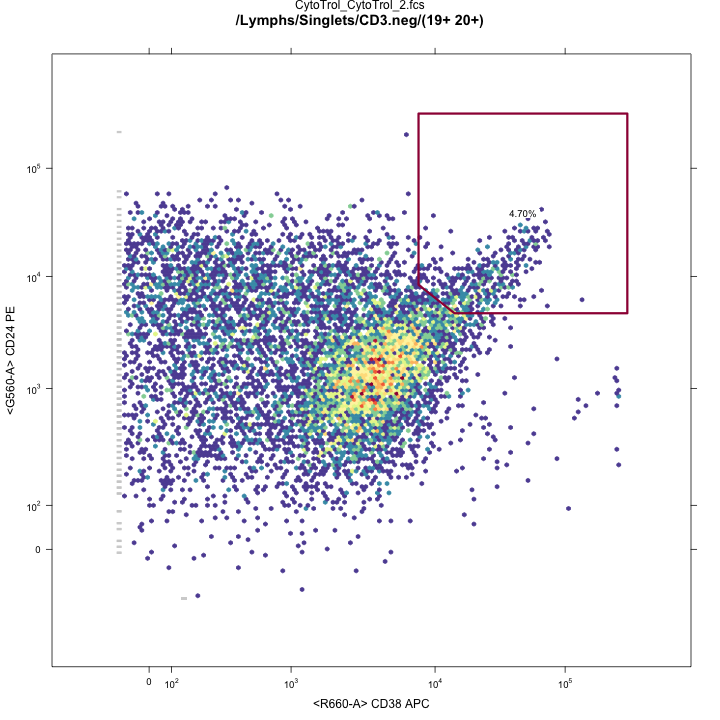
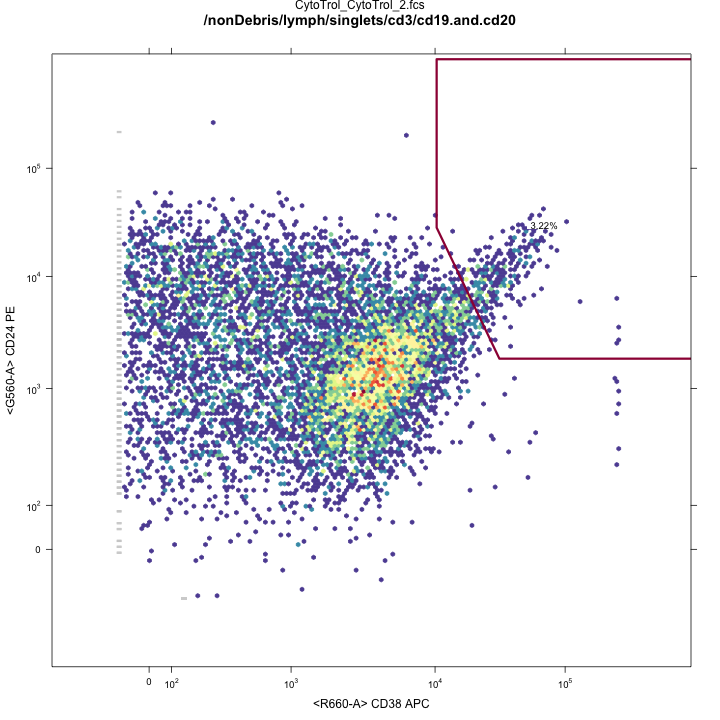
Manual Gating
Automated Gating
FlowCAP: Critical Assessment of Cell Population Identification Methods
Three-year old series of workshops for benchmarking automated gating methods vs. manual gating
FlowCAP I and II
Focus on high dimensional automated gating.
FlowCAP III
Focus on reproducibility, applicability to clinical trials.
- Reproduce cell population statistics from standardized Lyoplate data with minimum variability and bias.
- Predict vaccination status from ICS data.
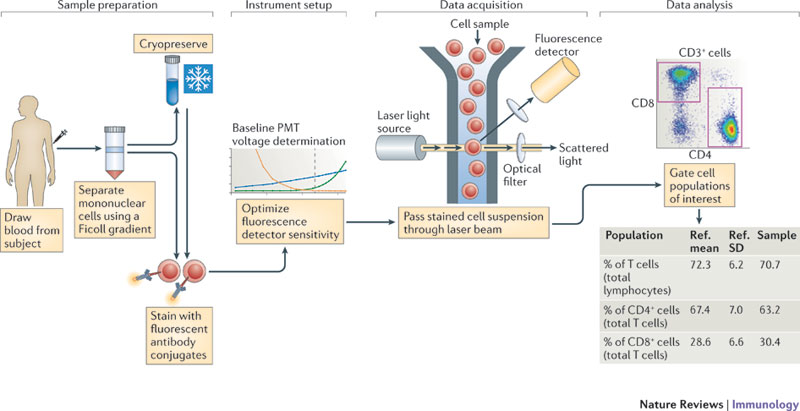
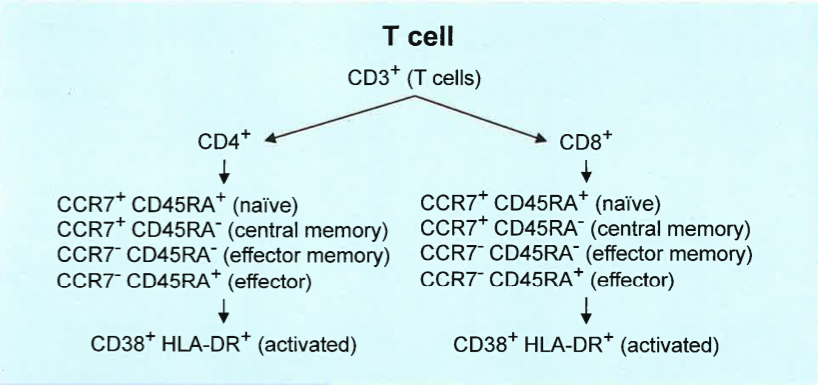
Standardized Lyoplate Staining Panels
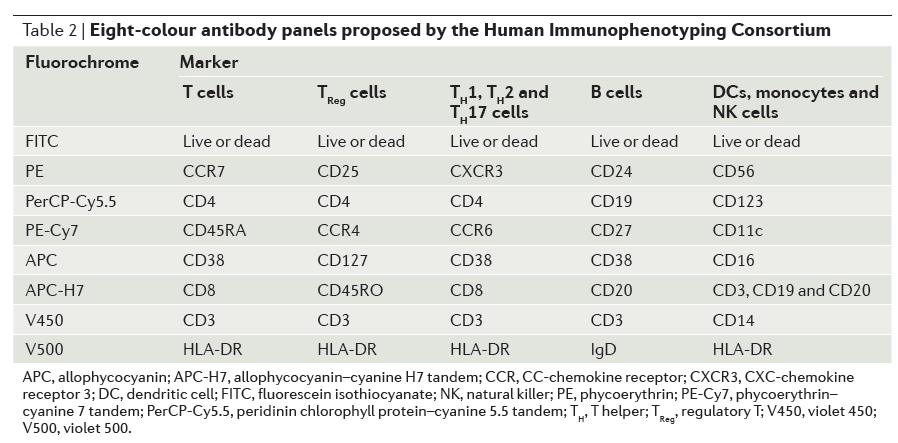
Maecker, McCoy, Nussenblatt, Nat Rev Immunol, 2012
FlowCAP III: Lyoplate Standardized Gating
Identify Gating Methods with low variability and bias relative to centralized manual gating
- FlowCAP focused on the T-cell and B-cell panels.
- 9 sites, 4 replicates of cryopreserved cells per site.
Why Compare Against Manual Gating?
In clinical trials, the things we want to measure are well defined a-priori.
- Flow assays are well defined.
- Cell populations of interest are well defined.
- No immediate need to go fishing with high-dimensional gating for "discovery".
Generally large data sets.
- Gating is tedious and subject to human error (this has been shown).
- Automate the repetitive tasks.
- Robust
- Reproducible
Centralized Gating Reduces Cell Population Variability
FlowCAP Participants (Lyoplate Challenge)
DENSE ( A. Brandes, Broad Institute )
flowDensity ( J. Taghiyar, BC Cancer Agency )
OpenCyto ( J. Ramey, FHCRC )
emcytom ( K. Wang, University of Queensland )
FLOCK ( R. Stanton, JCVI )
Centralized Gating ( Current best practice )
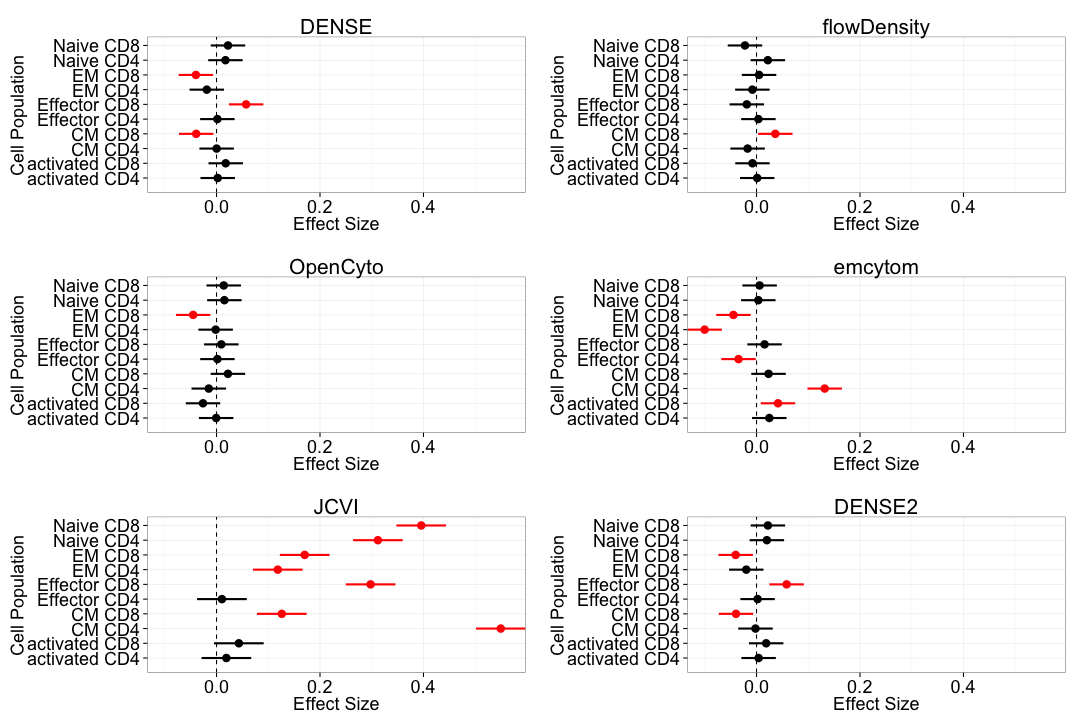
FlowCAP III Gating Evaluation Criteria
Assess automated methods relative to central manual gating.
- Variability
- Coefficients of variation across centers
- Bias: \(RMSD_{gpc} = \sqrt{\frac{\sum(y_{gcpr}-\mu_{mpc})}{R}}\)
- Mixed Effects Model:
\(y_{gpcr}=\mu+\phi_{p}+\color{red}{\gamma_{g}}+\color{red}{\phi\gamma_{pg}}+(\phi\chi)_{pc}+\epsilon_{gpcr}\)
- Fixed gating and cell population effects.
- Random center \(\times\) cell population effects.
- Interested in interaction and contrasts of fixed effects. (\(\gamma_g + \phi\gamma_{pg} -\gamma_0 - \phi\gamma_{p0} = 0\))
An ideal automated gating method will have low bias and low variability for each population.
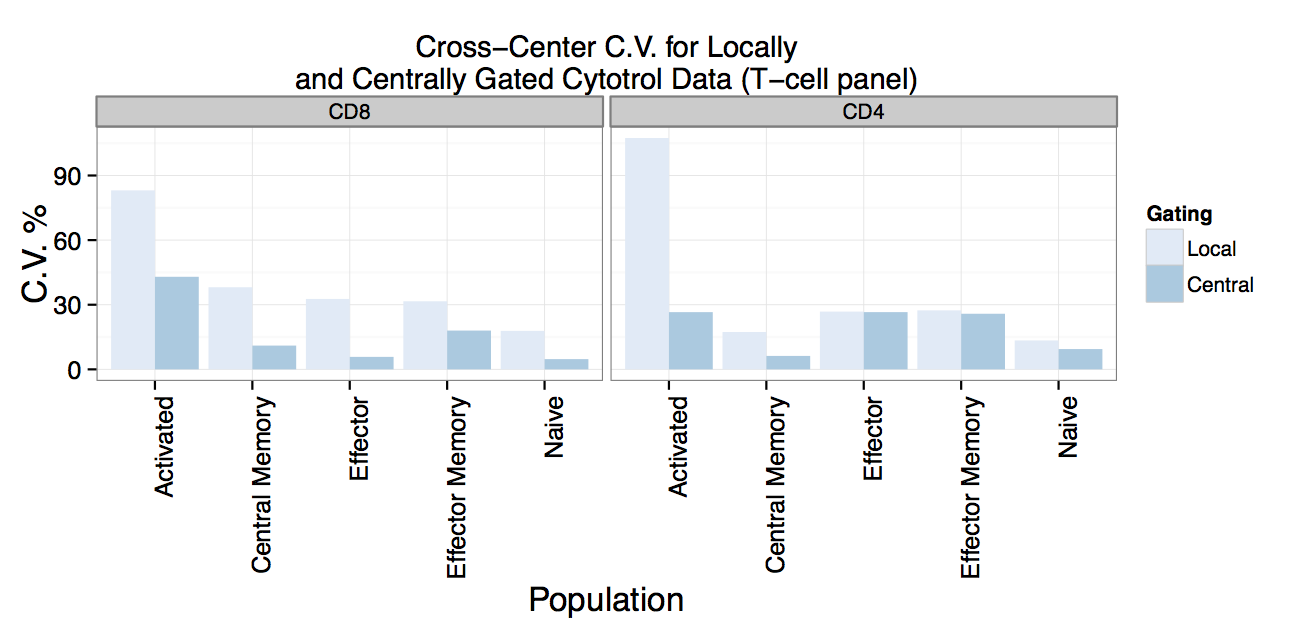
T-cell Panel Results
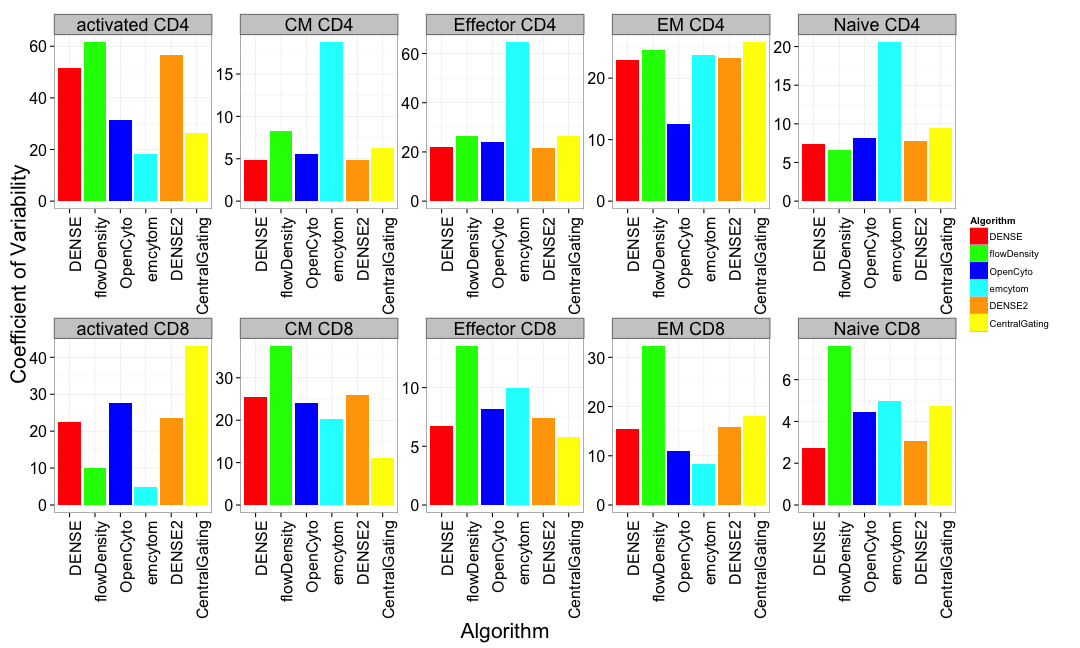
Cross center variability of automated gating methods is comparable to centralized gating.
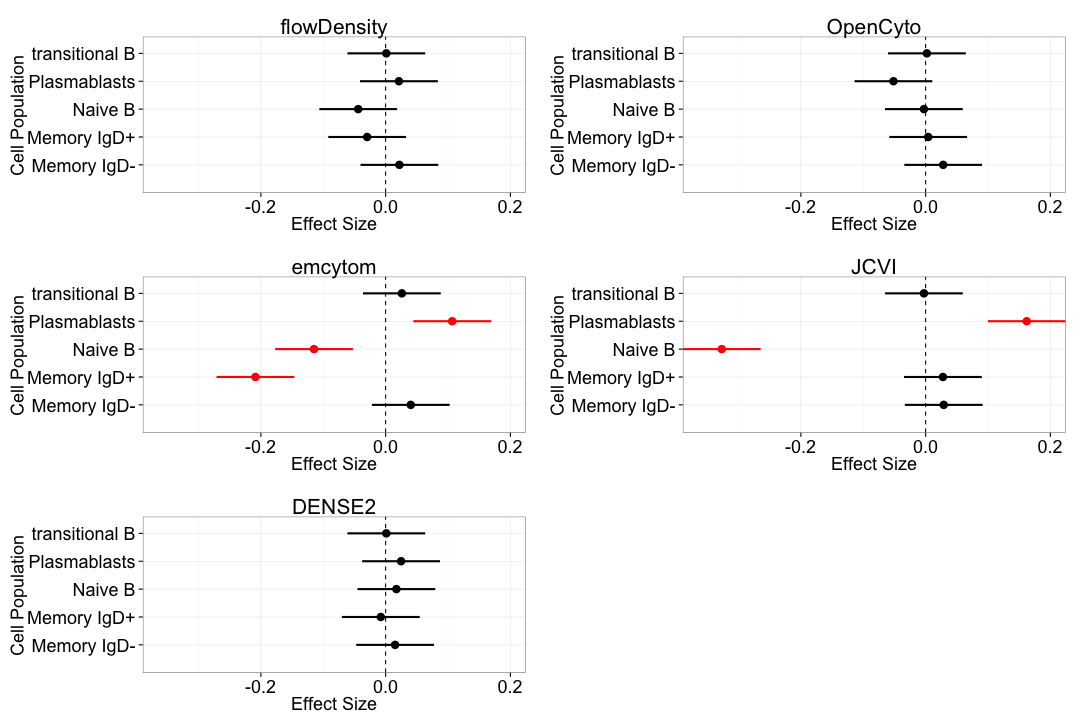
B-cell Panel Results
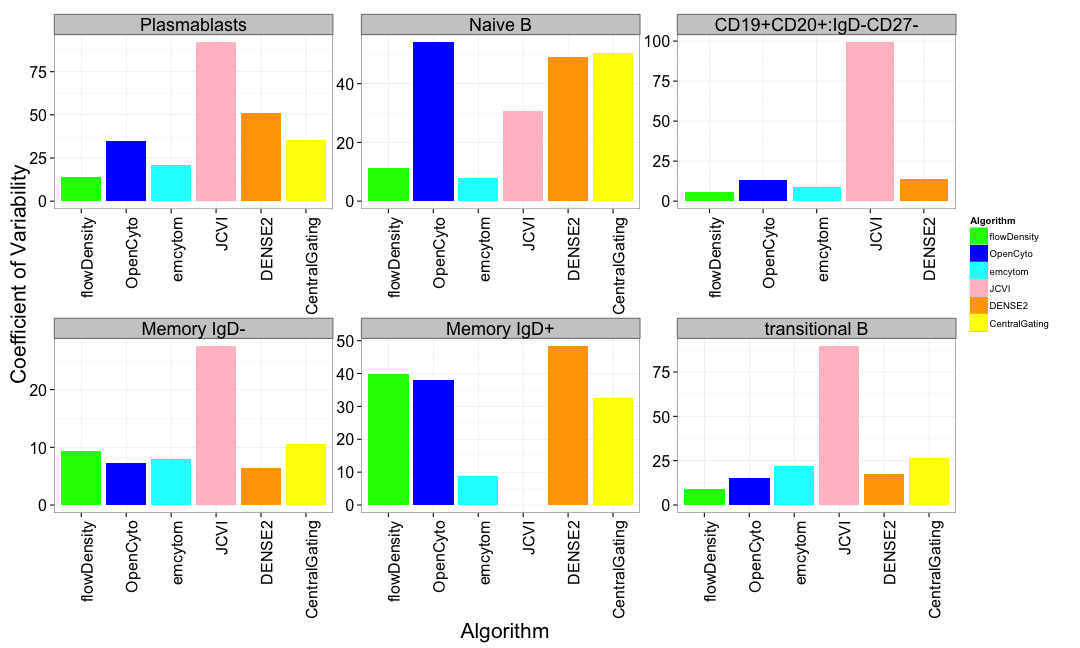
At least one method per panel matches the variability of centralized gating for all populations.
Bias: T-cell panel
Bias: B-cell panel
Acknowledgements
R Flow Tools
Bioconductor Flow Package Contributors
FHCRC
Raphael Gottardo
Mike Jiang
John Ramey
BCCA
Ryan Brinkman
Nima Aghaeepour
Jafar Taghiyar
TreeStar
Adam Triester
Jay Almarode
FlowCAP
Lyoplate Data
Holden Maecker (Stanford)
Phil McCoy (NHLBI)
FOCIS and HIPC consortia
Participating Centers
FlowCAP Coordinating Committee
Raphael Gottardo (FHCRC)
Ryan Brinkman (BCCA)
Richard Scheuermann (JCVI)
Tim Mossman (U Rochester)
Nima Aghaeepour (Stanford, BCCA)
Thanks to all FlowCAP
Participants
NIH and NIAID
Take Home Message
There are automated gating algorithms that are sufficiently robust to be useful for data analysis today.
- DENSE (Broad Institute), flowDensity (BCCA), OpenCyto Framework (FHCRC)
A wealth of FREE open-source flow tools are available for R.
- OpenCyto framework emphasizing ease of use.
- Handling real-world data sets (large studies)
- Access manually gated FlowJo data in R.
- (support for Mac, Windows, version X and older)
There is now little reason not to start exploring your flow data in R.
Get these slides online: http://www.github.com/gfinak/Talks/RFlowToolsFlowCAP